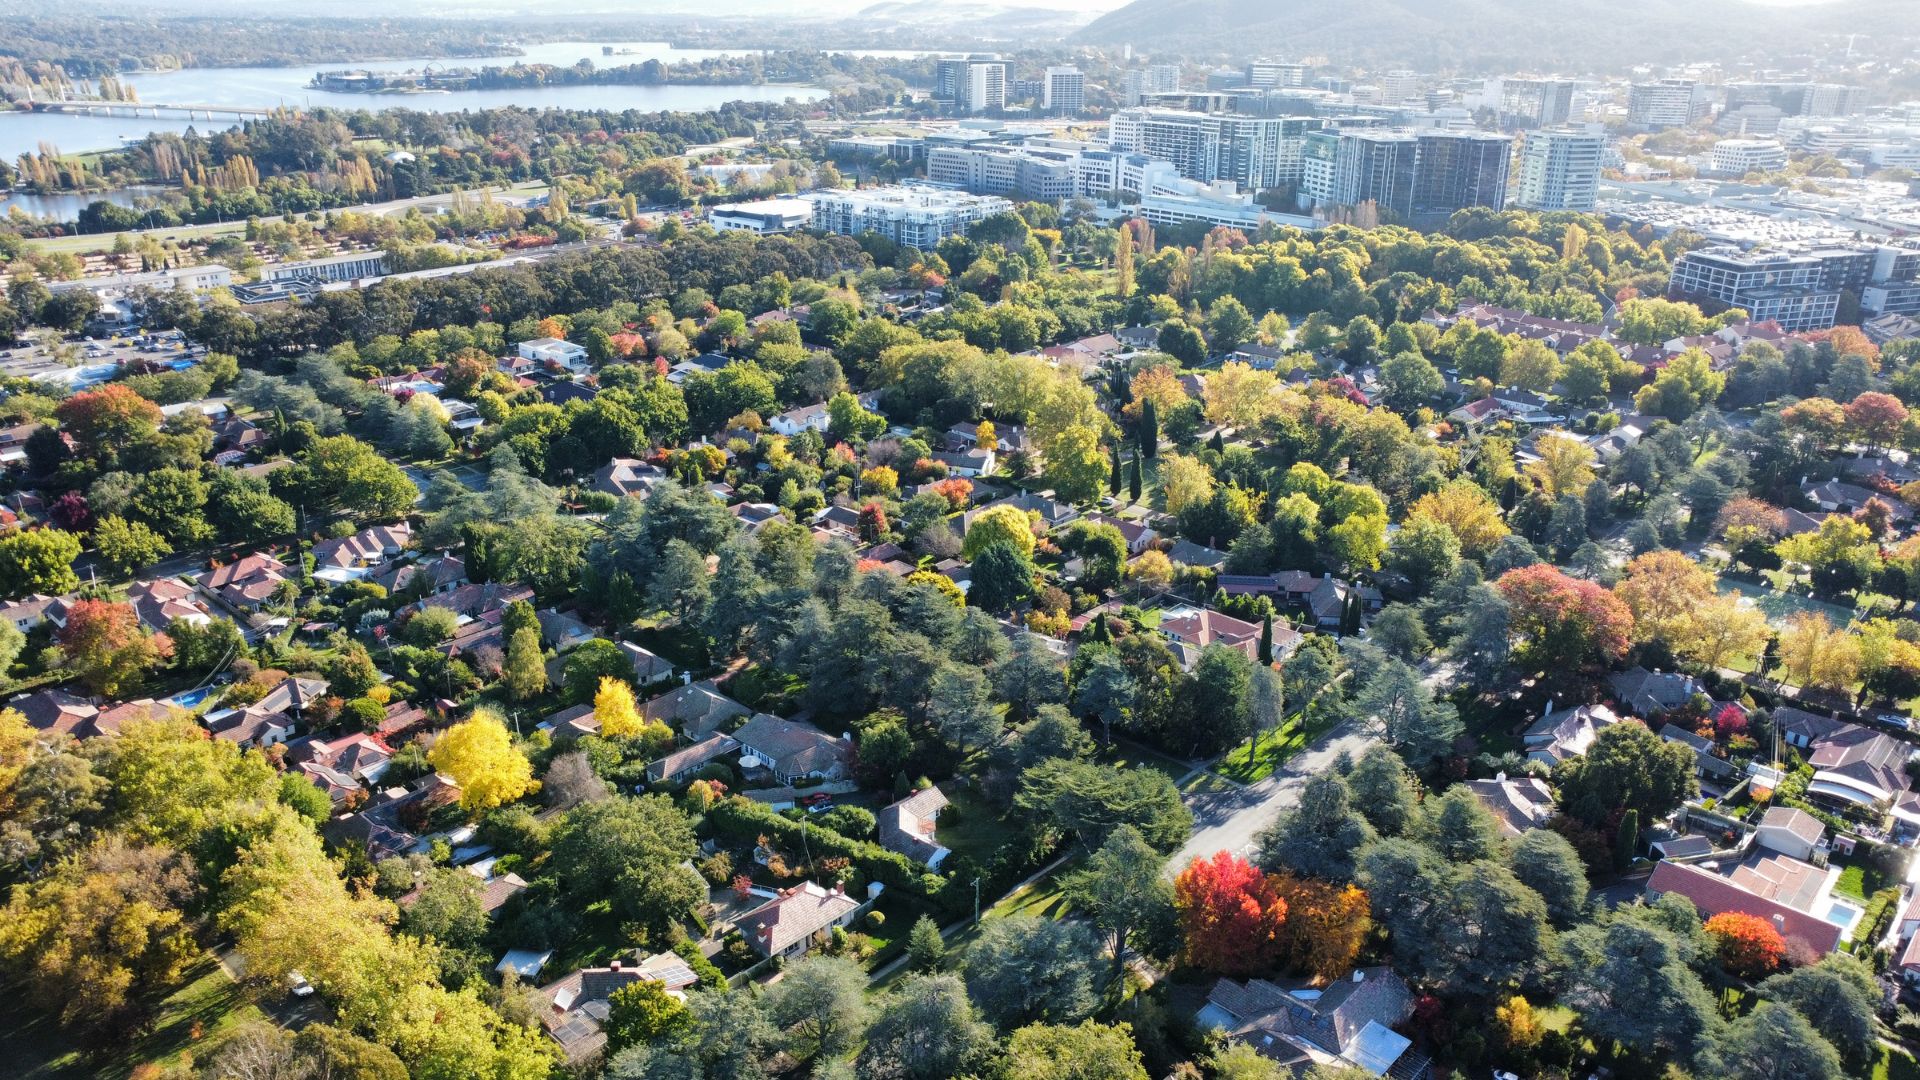
Most Canberrans rely on fossil fuel powered cars as their main means of transport. This note analyses how planning laws contribute to this car dependence, by reducing the number of Canberrans who live within walking and cycling distance of jobs and amenities, and along existing public transport corridors.
We focus on a number of ‘missing middle’ Canberra suburbs that have relatively high take-up of public and active transport, but contributed few or no new homes over the 5-year period to 2021. We find that if these suburbs increased their housing supply to the average of similar suburbs over this period, there would be 2000 fewer commuter cars on the roads, while the number of Canberrans using public and active transport to commute to work would increase by almost 10%. This is equivalent to around 2 kilotonnes of avoided CO2 emissions per year. The results show the urgent need for ambitious missing middle planning reform to boost clean transport and achieve the ACT’s climate goals.
The following note is the first in a series investigating how zoning in the ACT impacts climate action, housing supply, and the built environment. The note is also available in PDF format.
1 Missing middle suburbs and transport emissions
Canberra is often viewed as a climate leader among Australian cities, with a strong track-record of decarbonising our electricity usage, and an ambitious goal of achieving net zero emissions economy-wide by 2045.1 However, significant challenges remain regarding the decarbonisation of transport, which currently make up more than 60% of the ACT’s total emissions.2 While electric vehicle (EV) take-up as a share of new car sales in Canberra is high compared to other states and territories, EVs still only make up around 1.5% of Canberra’s total light vehicle fleet, meaning the vast majority of car trips will be powered by fossil fuels well into the future.3 The ACT also falls behind New South Wales in terms of the share of trips taken on public and active transport.4
As the ACT Government notes in both its draft Active Travel Plan and its Climate Change Strategy, EV uptake alone will not be sufficient to achieve the rapid decarbonisation of the transport sector. Concerted effort is required to boost the share of Canberrans using clean transport options such as public transport, cycling, and walking, including through increasing investment in bike paths, accessible footpaths, busses, and light rail. Investing in clean transport - rather than solely focusing on EVs - also has numerous other benefits for the ACT community, including by reducing fuel costs for low-income ACT families, improving urban air quality (which is impacted by tyre-wear even when vehicles are zero-emissions5), and reducing traffic congestion and road fatalities for cyclists, drivers, and pedestrians.
An under-studied factor in this transition toward clean transport is the role of Canberra’s planning system in limiting urban density. Around 80% of Canberra’s residential land is zoned to exclude medium density housing, which increases the distances individuals have to travel on a daily basis, and so favours car-dependence over clean transport options. As researchers from the Intergovernmental Panel on Climate Change have found, increasing density and reducing suburban sprawl is a key to reducing carbon emissions.6
This naturally raises the question: is the ACT’s planning system helping or hindering clean transport uptake? To get at this question, Chart 1 provides a breakdown of new housing growth between 2016 and 2021, arranged by decile of clean transport uptake.7
Chart 1: Many well-located ‘missing middle’ suburbs see low housing growth
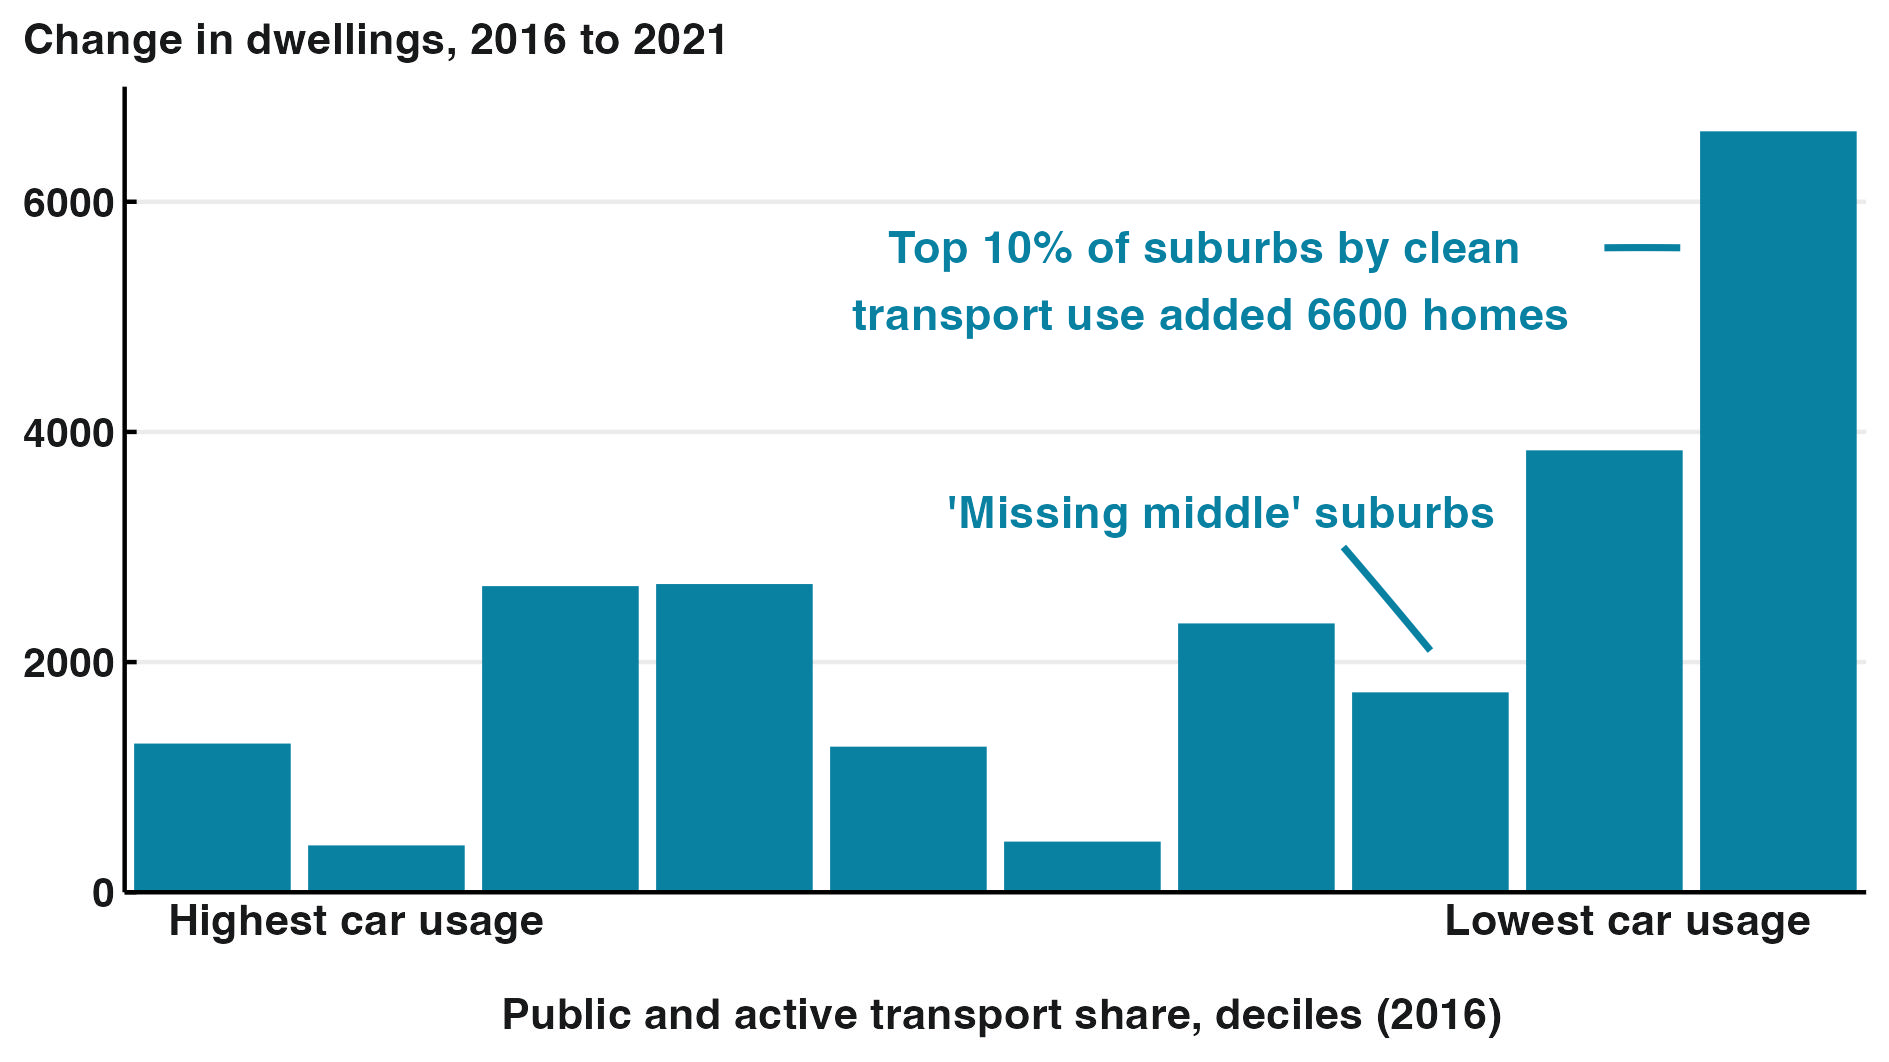
Source: Greater Canberra analysis of ABS Census of Population and Housing 2016 and 2021.
While growth in housing among suburbs in the top 10% of clean transport usage was strong, with over 6600 dwellings added, housing growth is significantly weaker among suburbs around the 70th percentile for clean transport usage. We define this group as ‘missing middle’ suburbs - suburbs in the top 50% for clean transport uptake but below average growth in housing supply. In general, these suburbs added significantly fewer homes than rapidly growing but less well-located suburbs such as Taylor or Coombs, which ranked in the bottom 30% for clean transport uptake.
Even among suburbs in the top 10% of clean transport uptake, housing growth varies significantly. Chart 2 provides additional information on these 22 missing middle suburbs, which are highlighted in orange.8 Notably, inner Canberra suburbs such as O’Connor, Barton, Reid and Ainslie saw low or negative growth in dwellings between 2016 and 2021, which severely limited housing opportunities within walking and cycling distance of centrally-located jobs and amenities. This is driven by the large portions of these suburbs which are zoned RZ1 and hence exclude missing middle homes, as compared with suburbs like Dickson, Kingston and Braddon, which have seen more widespread medium-density housing development.
Chart 2: Housing growth is uneven among well-located suburbs
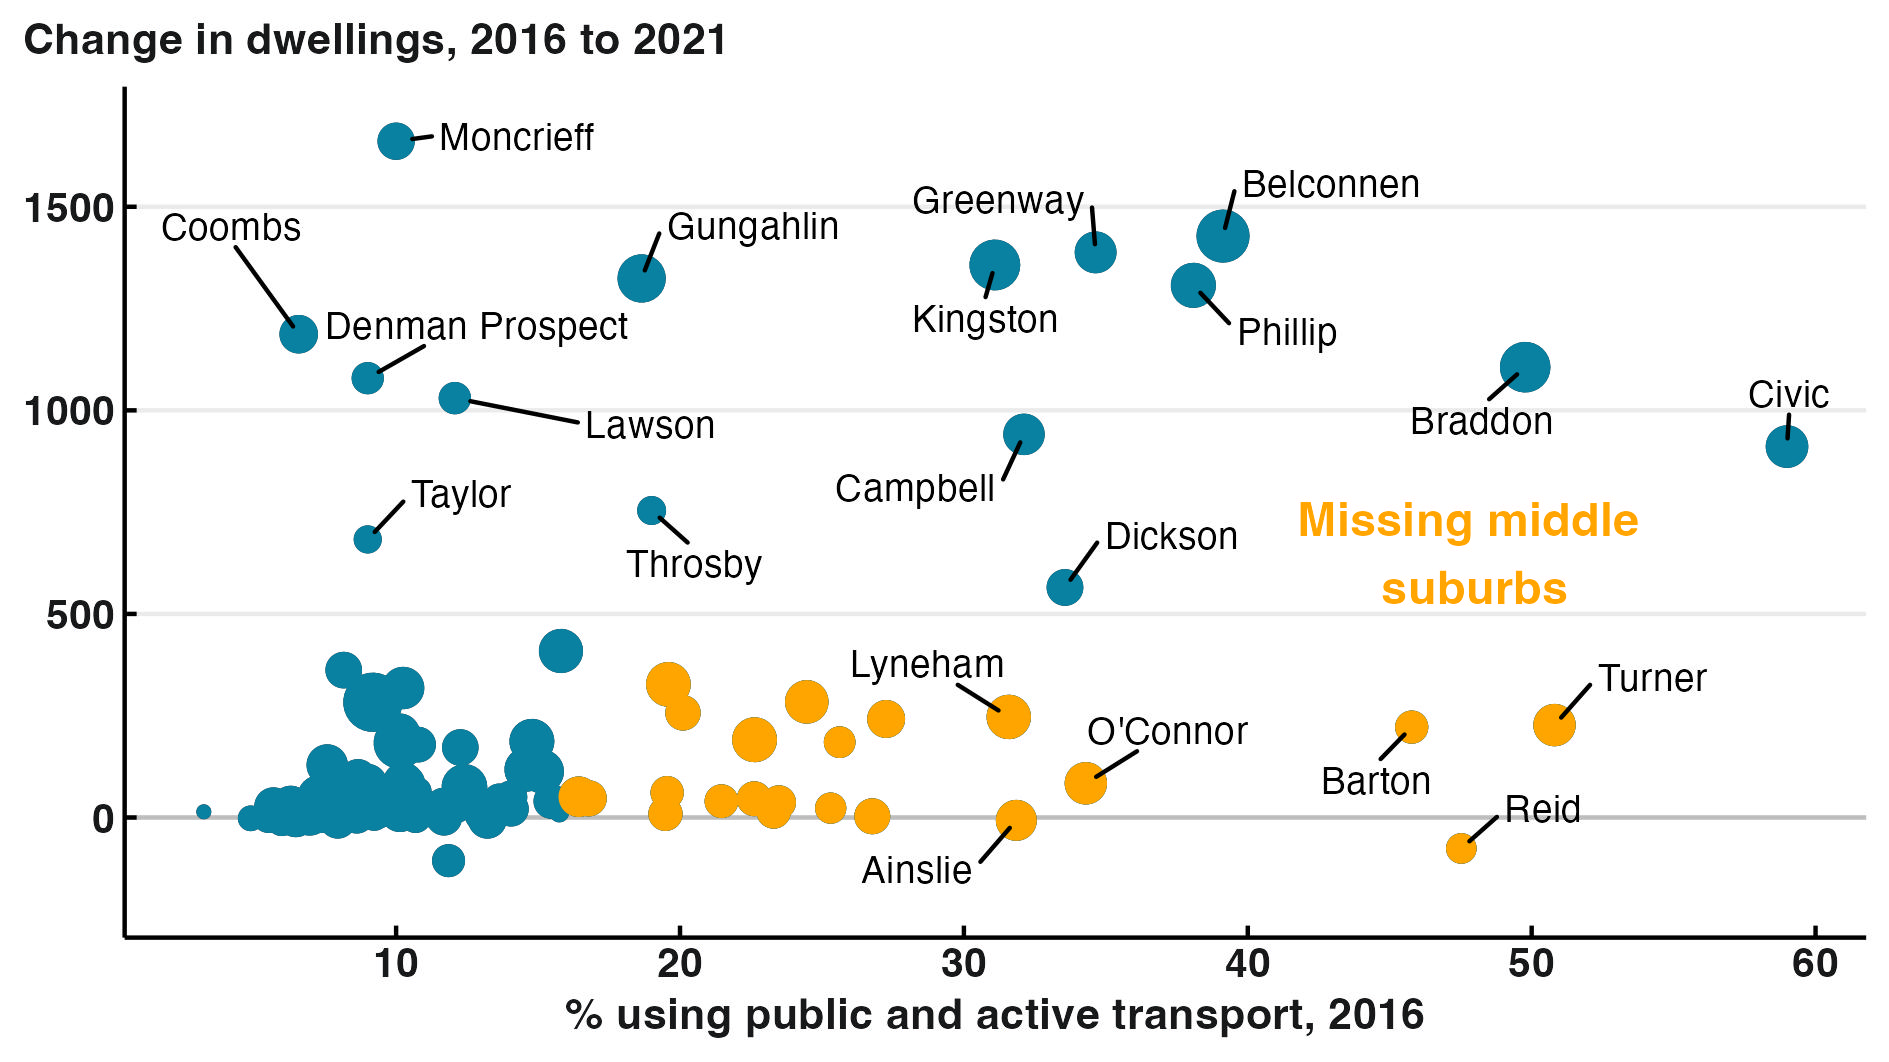
Source: Greater Canberra analysis of ABS Census of Population and Housing 2016 and 2021.
2 Boosting clean transport through more density
These missing middle suburbs are a wasted opportunity for climate action principally because their residents are much more likely to be able to use existing clean transport options. For instance, for every 100 homes in a missing middle suburb, there will be around 60 car commuters, and 25 commuters using clean transport options. By comparison, among suburbs with below median clean transport uptake, there are around 100 car commuters per 100 homes, and less than 10 clean transport commuters.9 Due to the fact that Census data only covers individuals travelling to work, this analysis excludes car trips for non-work purposes, which are also likely to be significantly lower in missing middle suburbs.
As such, building more well-located homes in missing middle suburbs represents a huge opportunity to speed up Canberra’s transition toward net zero transport emissions. This can be seen by considering what would have happened if around 30% of the 23,000 new homes added between 2016 to 2021 were shifted from areas with high car reliance, to those missing middle suburbs which saw relatively limited housing growth.
The impact of this scenario on the distribution of dwellings across the ACT can be seen in Chart 3. Highlighted in orange are the additional dwellings built if missing middle suburbs grew in line with the average growth in housing for similarly well-located suburbs. Areas in green indicate the corresponding decrease in demand for homes in suburbs with low clean transport uptake, assuming that these decreases were spread evenly across these suburbs in proportion to their population.
Chart 3: More homes in missing middle suburbs could make a big difference
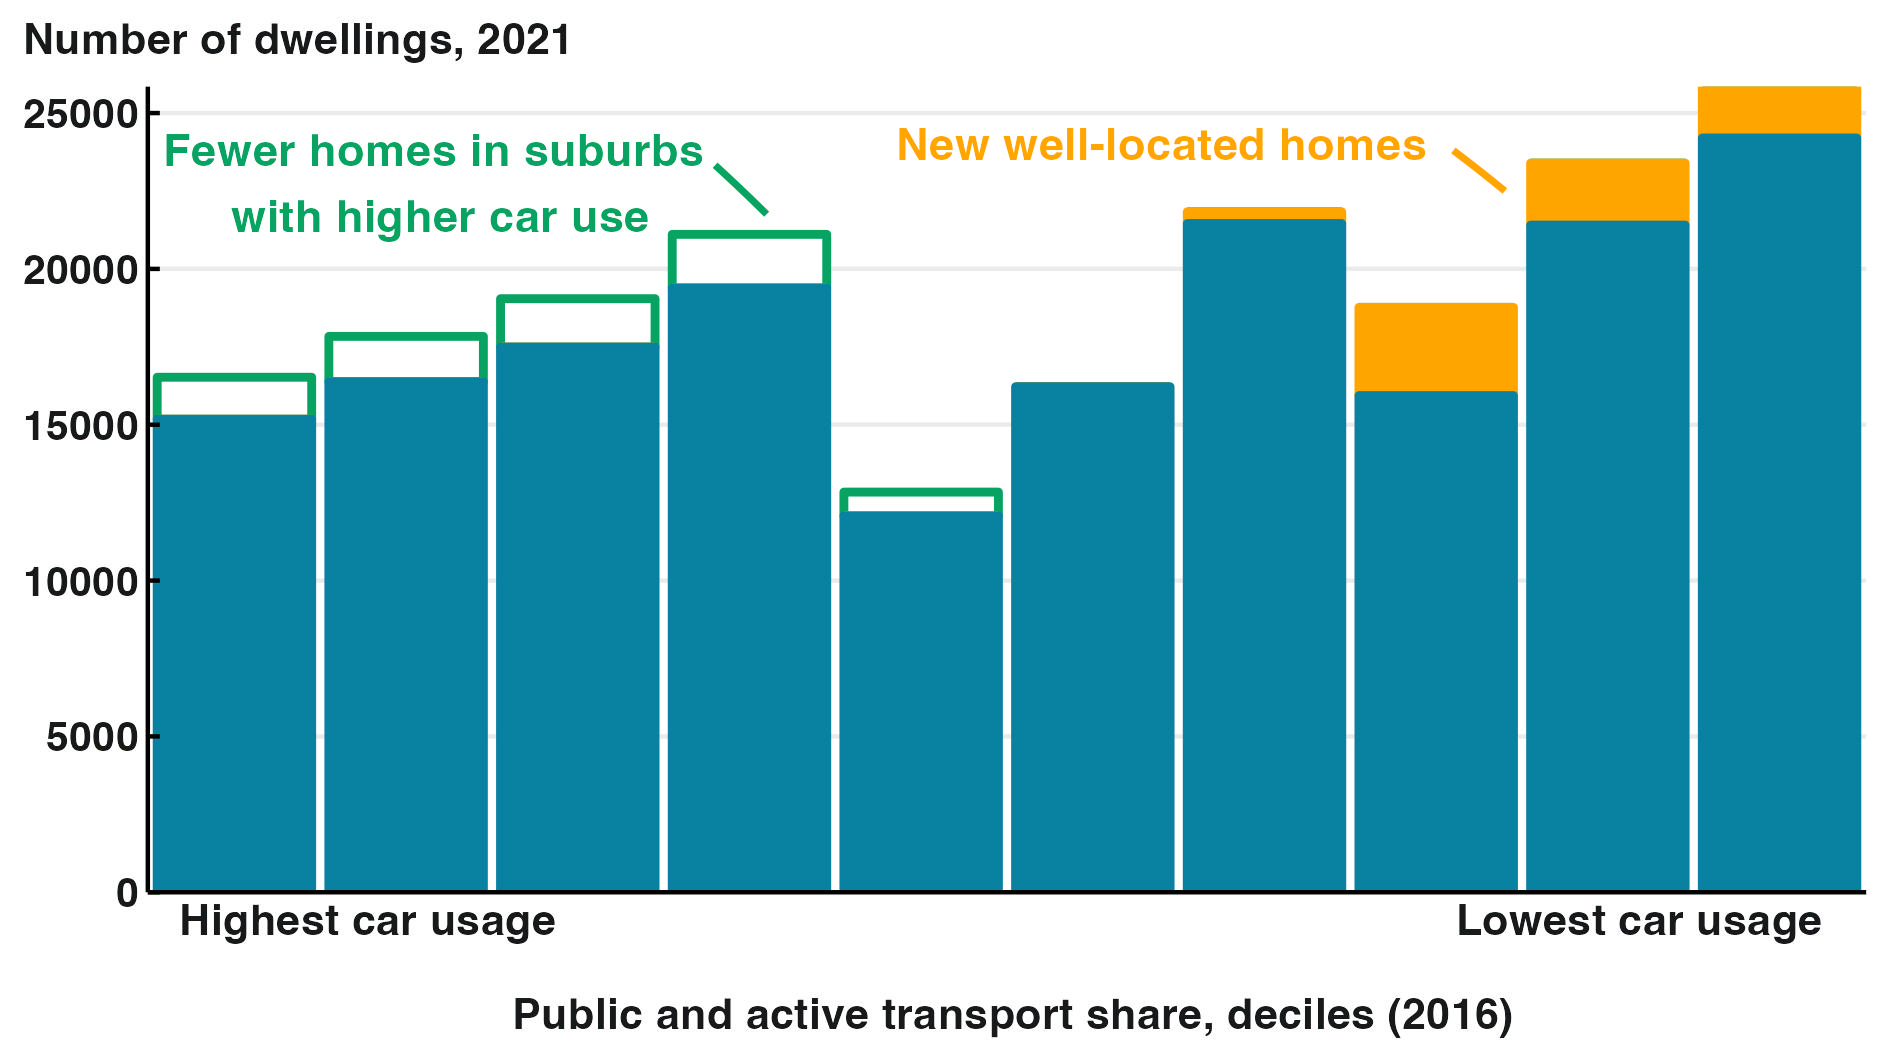 Source: Greater Canberra analysis of ABS Census of Population and Housing 2016 and 2021.
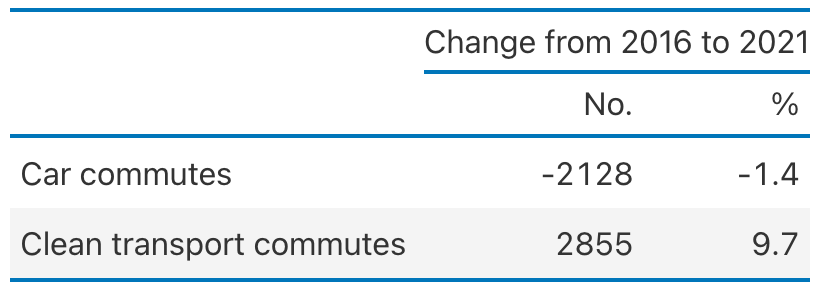
By using the ratio of commuters per dwelling outlined above, we can then estimate the net impact of this shift in housing growth on clean transport uptake in the ACT. The result is a reduction in around 2100 commuter cars in 2021, corresponding with a 10% increase in the number of people commuting using clean transport options (see Table 1).10
Assuming an average car commuting distance of around 13 kilometres each way,11 and an average of 200g CO2-equivalent direct emissions per km travelled by car, this would imply a reduction in ACT carbon emissions of around 2 kilotonnes per year.
Table 1: Projected impact of missing middle infill scenario
Source: Greater Canberra analysis of ABS Census of Population and Housing 2016 and 2021.
3 Implications for climate action in the ACT
Chart 4: Missing middle suburbs are currently projected to grow slowly
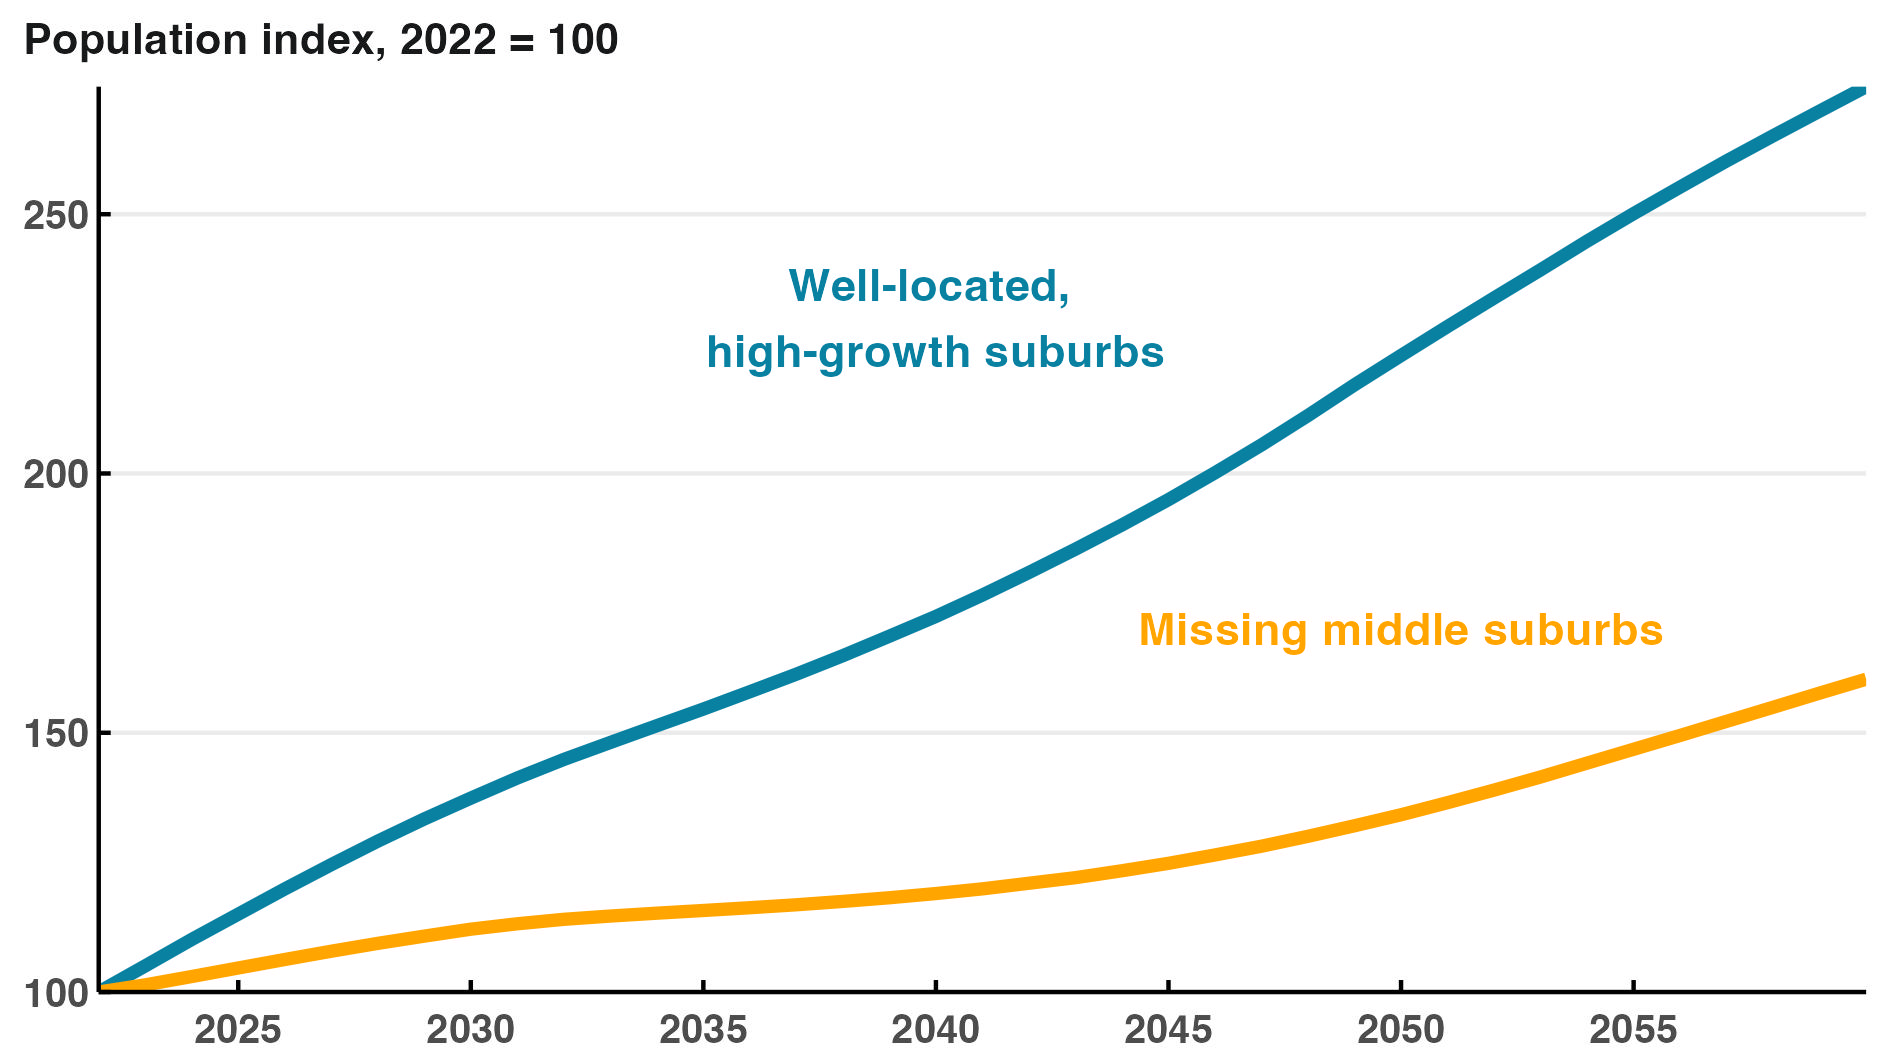
Source: Greater Canberra analysis of ACT Treasury Population Projections, 2022.
As the above analysis makes clear, slow housing growth in missing middle suburbs with excellent public and active transport uptake represents a major barrier to climate action in the ACT. Moreover, this trend is expected to continue (see Chart 4).
ACT Treasury projections indicate that the population of missing middle suburbs is expected to grow by only around 25% by 2045, while other similarly well-located suburbs are projected to almost double in size.
Clearly, policy intervention is needed to encourage more sustainable housing growth in well-located suburbs, and reduce pressure for additional greenfield development in areas with high car reliance. Fortunately, the ACT currently has a golden opportunity to implement the planning reforms that would enable this clean transport boost as part of the new Territory Plan, due to be released in the second half of 2023.
As part of the consultation on the initial draft Territory Plan, 15 Canberra organisations - including Greater Canberra - created the Missing Middle Canberra open letter, to support sensible, climate-conscious planning reform. The letter proposes four key reforms:
-
Enable the development of more private, public, and community-owned low-impact housing such as duplexes, terrace-houses, and townhouses by upzoning current RZ1 areas to the RZ2 standard, while allowing these new homes to be subject to the same streamlined approval requirements as existing detached homes.
-
Rejuvenate local centres by upzoning current RZ2 areas to the RZ3 standard to allow for more terrace-housing and low-rise apartment buildings.
-
Reform the CZ4 local centre zone to allow for more apartments above local shops by increasing the height limit to at least three storeys while reserving ground floor space for commercial use.
-
Enable more sustainable designs and lower housing costs by reducing mandatory parking requirements to 1 car space per home across all residential zones.
While these reforms would enable new housing across Canberra, they would be especially impactful for missing middle suburbs, boosting the share of Canberrans able to forgo polluting car commutes in favour of convenient clean transport alternatives.
In addition to these reforms, the ACT Government could consider additional targeted upzoning to RZ4 and RZ5 levels, to allow for more low and mid-rise apartments in areas that are particularly well located near to public transport or employment centres. Suburbs with potential for such upzoning include Turner, Griffith, Forrest, and Reid.
Both missing middle planning reform and additional targeted upzoning should be accompanied by additional investment in active, public transport, and community infrastructure in these areas. Key elements of these investments could include improved urban streetscapes and bike corridors, and new ‘vertical’ schools in ACT town centres.
4 Additional data and limitations
4.1 Full list of missing middle suburbs
A full list of the missing middle suburbs identified above is at Table 1.
Table 2: Key data on missing middle suburbs
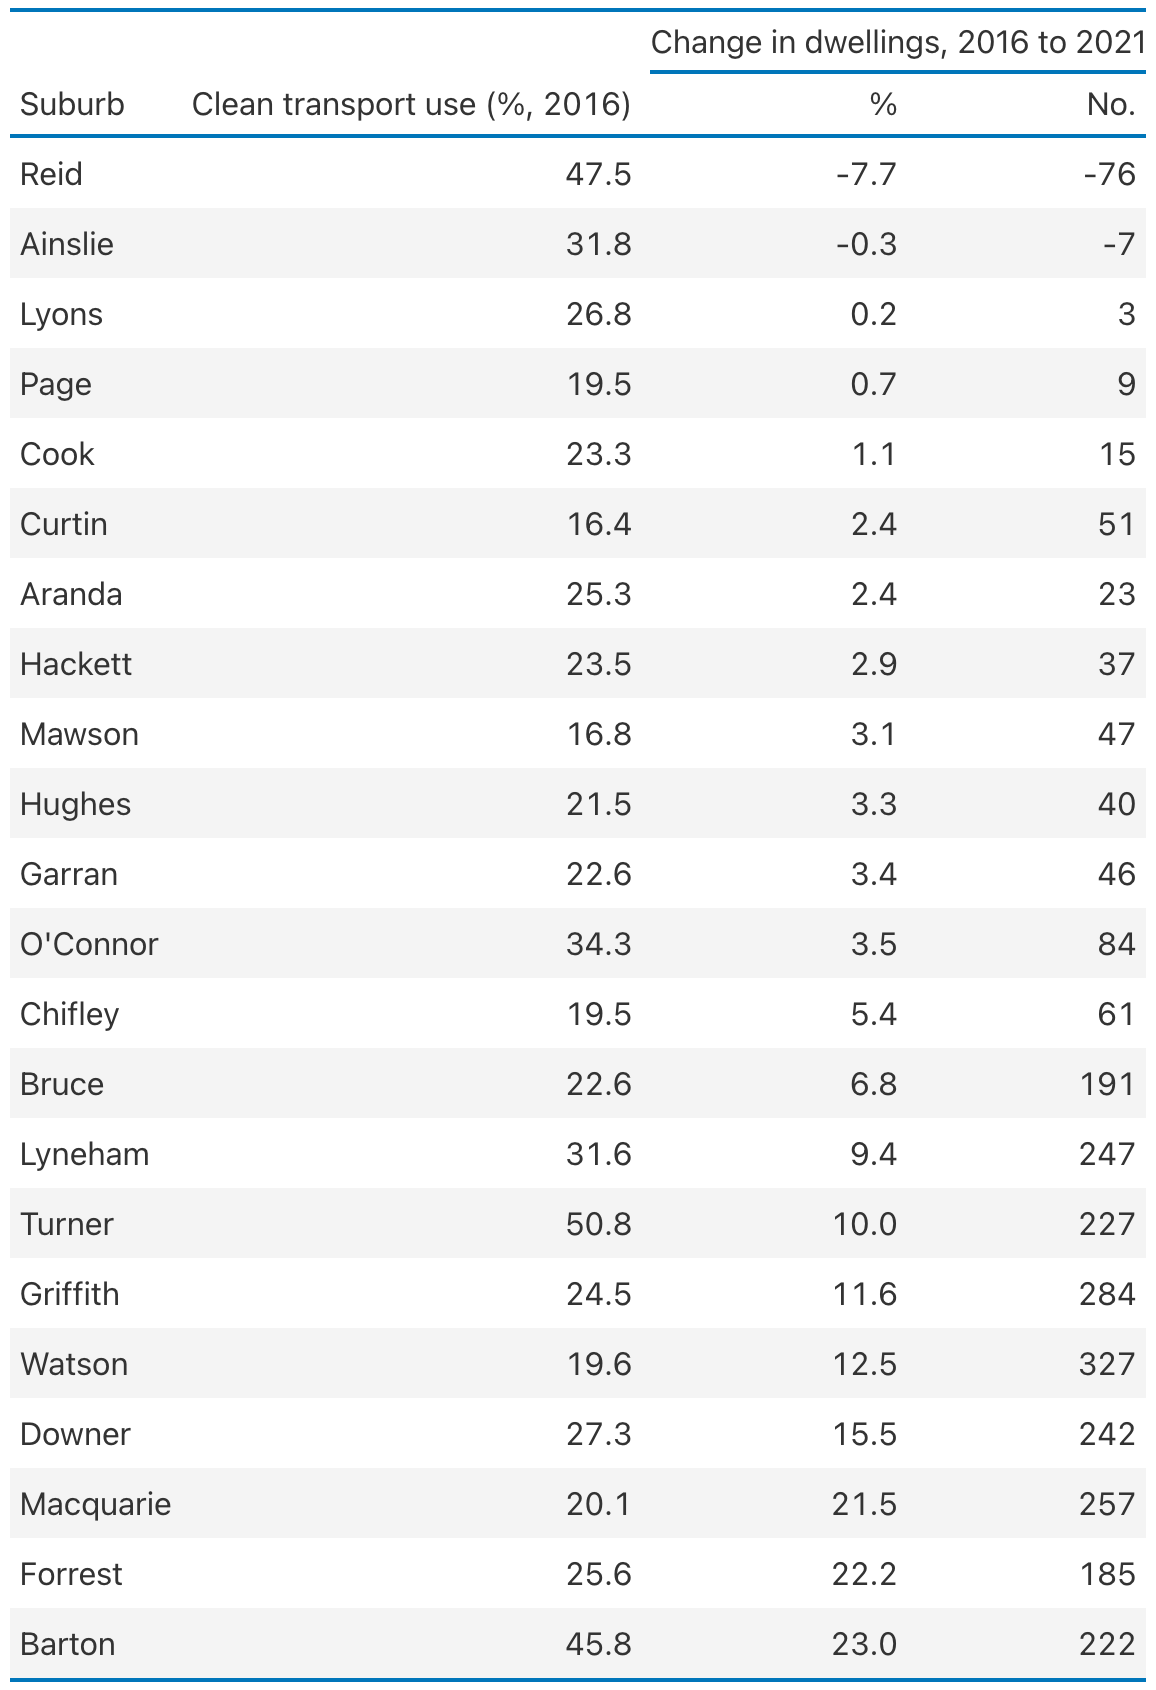
Source: Greater Canberra analysis of ABS Census of Population and Housing 2016 and 2021.
Missing middle suburbs were defined as those suburbs where clean transport made up a higher than average share of commuter trips, but where housing growth was lower than the average for similar suburbs.
4.2 Notes on data used
Throughout this note, figures for public, active, and vehicle transport mode-shares by SA2 are taken from the 2016 Census ‘method of travel to work’ data. This is consistent with the methodology used in similar recent research from the Climate Council. Data from 2016 rather than 2021 is preferred due to the fact that data from the 2021 Census is heavily impacted by the COVID-19 pandemic, meaning that 2016 data is likely to better represent trends in transport mode-share across suburbs over the near term.
It is important to note that:
-
This data does not account for the introduction of light rail stage 1, which now makes up a significant proportion of all trips on Canberra’s public transport network, especially in suburbs along the corridor. This particularly impacts suburbs such as Gunghalin and Franklin.
-
There is no or limited data available for Throsby, Taylor and Denman Prospect, as these suburbs were only fully established following the 2016 Census. In these instances, transport mode share was estimated based upon the mode share of nearby suburbs.
ACT SA2s with a population of fewer than 100 residents on Census night in 2021 were excluded from the above analysis. The Duntroon SA2 was also excluded from analysis, as the high proportion of defence personnel living and working in the area is not reflective of broader trends across the ACT.
In addition, the scenario provided in Section 2 should not be read as a forecast of the potential impact of the introduction of the Missing Middle Canberra policy platform. Rather, it provides context on the potentially large reductions in Canberra’s climate emissions possible over the next decade with only relatively minor changes to planning policy.
Footnotes
-
Climate Council (2018), Powering Progress: States renewable energy race. ↩
-
ACT Government (2022), Active Travel Plan - Consultation Draft. ↩
-
Australian Electric Vehicle Association (2023), ACT EV Statistics. ↩
-
Climate Council (2022), Are we there yet? Clean transport scorecard for Australian states and territories. ↩
-
Timmers and Achten (2016), Non-exhaust PM emissions from electric vehicles. ↩
-
For a summary of this research see Greater Canberra (2022), Canberra’s planning rules are blocking climate action. ↩
-
Throughout this note, data for public, active, and vehicle transport mode-shares by SA2 is taken from the 2016 Census. See Section 4 - Data and limitations, for further discussion. ↩
-
A full list of these suburbs is available at Table 2 in Section 4.1. ↩
-
The difference in the total number of commuters per home is principally due to differences in the number of employed persons and the ratio of persons-per-dwelling across suburbs. ↩
-
The number of new clean transport commutes under the scenario is larger than the number of avoided car commutes because of differences in employment and working from home rates across suburbs, and because some car commutes involve multiple passengers. ↩
-
ABS (2018), Commuting to Work - More Stories from the Census 2016. ↩